from IPython.core.display import HTML

def _set_css_style(css_file_path):
   """
   Read the custom CSS file and load it into Jupyter.
   Pass the file path to the CSS file.
   """

   styles = open(css_file_path, "r").read()
   s = '<style>%s</style>' % styles
   return HTML(s)

_set_css_style('rise.css')
numpy: arrays and functions
numpyarrays- Math with arrays
- More advanced slicing
- Array views vs. copies
- Reading in data with
numpy
Arrays
numpy arrays are dense, continuous, uniformly sized blocks of identically typed data values
import numpy as np
L = [[0,1],[2,3]]
A = np.array(L)
print("L:",L)
print("A:\n",A)
print(type(L),type(A))
Array memory layout
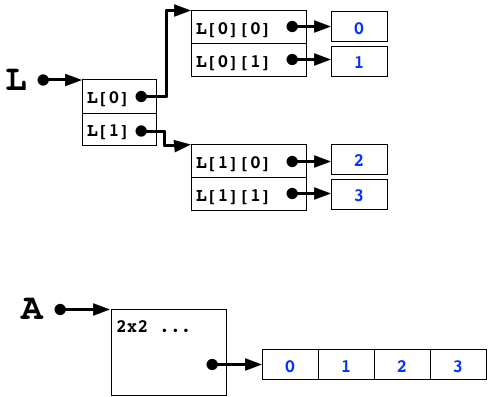
Array memory
In the standard python interpretter, the return value of id is the memory address of the object.
print(id(L))
print(id(L[1])-id(L[0])) # rows are far away
print(id(L[0][1])-id(L[0][0])) # columns not so much
Why does this matter?
Keeping data close together results in faster access times.
- It's easier to figure out the location of the data
- The data is more likely to fit in the processor's cache
If you have a block of dense numerical data, store it in a numpy array
Creating numpy arrays
Note that np.ndarray and np.array are the same thing.
A = np.array([1,2,3,4])
A.dtype # type of what is stored in the array - NOT python types!
A.ndim # number of dimensions (called axes in numpy)
A.shape # size of the dimensions as a tuple
A.reshape((4,1)).shape # a column vector
Definitions of dimensions
A = np.array([1,2,3,4]).reshape(4,1)
A[0]
A[0,0]
Initializing numpy arrays
# can initialize an array with a list, or list of lists (or list of lists of lists, etc)
M = np.array([[1,2,3], [4,5,6.0]])
print(M.dtype, M.shape)
# if know the size, but not the data, can initialize to zeros:
Z = np.zeros((10,10))
# or ones
O = np.ones((5,10))
# or identity
I = np.identity(3) # this makes a 3x3 square identity matrix
print(Z.dtype) # note, default type is floating point
Z = np.zeros((10,10),np.int64) # can change type
print(Z.dtype)
numpy arrays behave like vectors
x = np.array([1, 2, 3])
y = np.array([3, 2, 1])
x + y
z = np.array([1, 1, 1, 1])
x + z
More math with arrays
By default, mathematical operations on numpy arrays with the same shape are performed element-wise
Vector/matrix operations (inner product, etc.) can be accessed via other numpy functions
x = np.array([1, 2, 3])
3 * x
x * x
y = np.array([2, 2, 2])
x**y
x/y
Indexing and slicing
numpy arrays can be indexed and sliced a lot like python lists, but take tuples of values to reference each dimension
M = np.array([[0,1,2],[3,4,5]])
M
print(M[1,1])  # indexing
print(M[0,-1]) # last item of first row
print(M[0,1:]) # can have slices - all but first column of first row
print(M[1], M[1,:]) # missing indices are treated as complete slices
What is M[1,1]?
M = [[0,1,2],[3,4,5]]
M[1, 1]
Advanced slicing: integers
numpy arrays support advanced indexing by arrays of integers or booleans:
A = np.array([0,1,4,9,16,25])
print(A[[2,5]]) # choose just indices 2 and 5
Advanced slicing: boolean
Boolean numpy arrays can be used to select elements
b = A > 4
print(b)
print(A[b])
Slicing assignment
print("b =",b)
A[b] = 0
print(A)
What is the new value of S?
S = np.array(['a','b','c','b','a'])
S[S != 'a'] = 'z'
S
Array views vs. copies
- A
numpyarray object has a pointer to a dense block of memory that stores the data of the array - Basic slices are just views of this data - they are not a new copy
- Binding the same object to different variables will not create a copy
- Advanced slices will create a copy if bound to a new variable - these are cases where the result may contain elements that are not contiguous in the original array
- Advice: if you want to define a new, independent
numpyarray, do so explicitly
Views
A = np.array([[0,1,2],[3,4,5],[6,7,8]])
B = A   # A and B reference the *same* object
A is B
B[0,0] = 1000
A
Sliced views
row = A[1,:]
row
row[2] = 5000
A
Explicit copy
newMat = A.copy() # this will actually copy the data
newMat[0,0] = 0
A
newMat
Python also has a deepcopy function for containers that have references inside -- advanced usage
Advanced slices copy
A = np.array([[0,1,2],[3,4,5],[6,7,8]])
B = A[A > 4]
B
B[:] = -1
B
A
however...
A[A > 4] = -1
A
What is the value of A after this function call?
def z(M):
    M[:] = 0
A = np.array([1,2,3])
z(A)
A
Functions on arrays
numpy includes a number of standard functions that will work on arrays (or data types that can be converted into arrays)
A = [1,2,3,4]
np.mean(A)
np.sum(A)
np.sin(A)
Axes
Most aggregation operations take an axis parameter that limits the operation to a specific direction in the array
- axis 0: across rows (apply operation to individual columns)
- axis 1: across columns (apply operation to individual rows)
b = np.arange(12).reshape(3,4)
b
np.sum(b)
np.sum(b, axis=0)
np.sum(b, axis=1)
Loading data
genfromtxt (and the simpler loadtxt) can read in delimited files
np.genfromtxt('../files/Spellman.csv')
The default delimiter is whitespace which will not work with a csv
np.genfromtxt('../files/Spellman.csv', delimiter=',')
Loading data
Recall that numpy arrays are dense, uniformly typed arrays. Can't mix a gene name (string) with expression values (float).
strdata = np.genfromtxt('../files/Spellman.csv', dtype=str, delimiter=',')
strdata
header = strdata[0,1:].astype(int)
genes = strdata[1:,0]
values = strdata[1:,1:].astype(float)
len(strdata), len(strdata[0])
genes.shape
Data normalization
Q1: How would you rescale your data to range from 0 to 1?
(values-values.min())/(values.max()-values.min())
Q2: How would you rescale your data to have zero mean and unit standard deviation?
np.std((values-values.mean())/values.std())
Activity: Expression data
https://MSCBIO2025-2025.github.io/files/Spellman.csv
- Read this data into a numpy array
- Plot a histogram of the expression values for the first time point
- Plot a histogram of the expression values for the last time point
- Plot a histogram of the average expression value for the genes across all time points
- Plot the average expression value (across all genes) at each time point as a line graph
- Plot two series of average expression values: one for all genes where the first value is positive and the other for all genes where the first value is negative
f = open('../files/Spellman.csv')
lines = f.readlines()
print(lines[0])
print(lines[1])
import numpy as np
import matplotlib.pyplot as plt
times = np.array(lines[0].replace('\n', '').split(',')[1:], float)
exps = np.array(lines[1].replace('\n', '').split(',')[1:], float)
plt.plot(times, exps);
import matplotlib.pyplot as plt
#bins = [-3,-2,-1,0,1,2,3]
#bins = np.linspace(-3,3,100)
plt.hist(values[:,0],bins=100);
plt.hist(values[:,-1],bins=100);
bins = np.linspace(-3,3,100)
plt.hist(values[:,0],bins=bins, alpha=0.5,label="ts-40")
plt.hist(values[:,-1],bins=100,alpha=0.5,label="ts-260")
plt.legend(loc="best");
plt.xlabel("Expression", size=14)
plt.ylabel("Number of Instances", size=14)
plt.hist(values.mean(axis=1),bins=100);
plt.plot(header,values.mean(axis=0))
plt.xlabel("Time",size=14)
plt.ylabel("Avg. Expression",size=14);
plt.plot(header,(values[values[:,0]>0]).mean(axis=0),label="positive")
plt.plot(header,(values[values[:,0]<0]).mean(axis=0),label="negative");
plt.xlabel("Time",size=14)
plt.ylabel("Avg. Expression",size=14)
plt.legend()
For next time
Modeling simple differential equations in Python