from IPython.core.display import HTML

def _set_css_style(css_file_path):
   """
   Read the custom CSS file and load it into Jupyter.
   Pass the file path to the CSS file.
   """

   styles = open(css_file_path, "r").read()
   s = '<style>%s</style>' % styles
   return HTML(s)

_set_css_style('rise.css')
Iteration and data visualization
- Logical operators and conditional statements
- Group membership
- Loops and iteration
- Slicing
- Data visualization with
matplotlibandseaborn
Conditionals and control flow
if statements
- An
ifstatement conditionally executes a block of code - The condition is some Boolean value
- A block of code is delineated by consistent indentation.
- Blank lines and comments will not end a block
- Whitespace is significant - do not mix tabs and spaces
- In an
if..elif..elsestatement, only one block of code will be executed
if False:
    print(1)
elif True:
    print(2)
else:
    print(3)
What is val?
val = 0
if val >= 0:
    val += 1
elif val < 1:
    val += 2
elif True:
    val += 3
else:
    val += 5

    val += 7

val
pass
pass does nothing
if True:
    pass
else:
    print("I will never print")
Logical operators
and,or, andnotnothas higher precedence thanandwhich has higher precedence thanor- all three have lower precedence than comparison operators
- but use parentheses to avoid confusion
Compound example: not (x and y) = (not x) or (not y)
A more complex example
x = 3; y = 4; z = 5
(x != 3 or not y < 0) and (z < 10 or not y == 0)
print(x != 3)
print(not y < 0)
print(z < 10)
print(not y == 0)
Membership testing
in and not in can be used to see if an object is in a collection
l = [1, 2, 3]
1 in l
345 in l
"1" not in l
"good" in "goodness"
Membership depends on the container
'cat' in 'catalog'
'cat' in ['catalog', 'catastrophe']
Loops
i = 0
while i < 3:  # as long as this condition is true...
    print(i)  # ...execute this block of code
    i += 1
letters = ['a','b','c','d','e','f','g']
for i in letters: # for every item in this collection...
    print(i)      # ...execute this block of code with i set to the object
range
The preferred method of looping is to use a for loop. There are a number of builtin functions to help create collections to iterate over.
list(range(3))
list(range(1,10))
list(range(1,10,3))
What is val?
val = 0
for i in range(10):
    val += i

val
Iterable
for will loop over any iterable object
In addition to collections, this includes any object that can provide items one at a time (e.g., files)
f = open("../files/brca1.fasta")
count = 0
for line in f.readlines():
    count += len(line)
count
f = open("../files/brca1.fasta")
count = 0
for line in f:  # can iterate through file object directly!
    count += len(line)
count
break and continue
break will exit out of the entire loop while continue will skip to the next iteration
i = 0
while True:
    i += 1
    if i < 6:
        continue
    print(i)
    if i > 4:
        break
What is the value of x?
x = 0
while x < 100:
    if x < 50:
        pass
    elif x == 5:
        break
    x += 1

x
Slicing
What if you don't want to iterate over the full list?
s = "Hello"
s[0:2]
s[2:] # empty indices indicate remainder of string/list
s[:-2] # negative indices count from the back
s2 = "Hello, world"
s2[:-2]
Slicing a list
l = ["cat", "dog", "fish", "mouse"]
l[2:3]
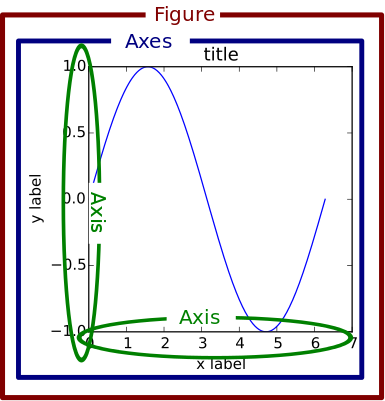
matplotlib
Makes easy things easy and hard things possible
plt has hundreds of functions for creating and manipulating plots
plt.plot creates line/point graphs
You can specify an arbitrary number of x, y, format arguments
import matplotlib.pyplot as plt
# next is a python notebook command to embed plot output in the notebook
# this may or may not be necessary depending on versions
%matplotlib inline
plt.plot([0,1,2,3], [0,1,2,3], '-b', [0,1,2,3], [0,1,4,9], '--r')
plt.ylabel('Y')
plt.xlabel('X')
plt.show() # not actually necessary in notebook
matplotlib can overlay multiple plots on the same figure
plt.plot([1,2,4,9,16], label='one') # if only one data set is provide, assume uniform x
plt.plot([0.5,1,2,4.5,8], '^-.', label='two') # keep adding to current graph until show is called
plt.legend() # uses labels
plt.show()
plt.show() # this doesn't show anything since we haven't created another plot
plt.close() # another way to finish with a plot
If you use the %matplotlib command in ipython, the plot will be updated with every command (can skip show)
Many options for formatting plots (marker type, color, size, ...)
Can also specify colors with hexadecimal or color-generating functions
plt.plot([1,2,4,6,7,4,2,2], 'orange', linewidth=6)
plt.show()
Plotting expression data
f = open('../files/Spellman.csv')
header = f.readline().rstrip().split(',') # rstrip removes newline
data = []
for line in f:
    data.append(line.rstrip().split(','))
len(data)
for row in data[:10]: # first 10 only
    values = list(map(float, row[1:]))
    times = list(map(int, header[1:]))
    plt.plot(times,values,label=row[0])
plt.legend(loc='upper center', ncol=5, prop={'size':7})
plt.xlabel("Time");
Bar charts
plt.bar([1.1,2.1,3.1], [30,40,50], 0.5, yerr=[2,10,12], ecolor="black", alpha=0.5, label="One")
plt.bar([1.4,2.4,3.4], [60,50,20], 0.5, color='r', yerr=[10,4,1], ecolor="black", alpha=0.5, label="Two")
plt.xticks([1.4,2.4,3.4], ['A','B','C'])
plt.ylim([0,100])
plt.legend();
Histograms
import random
rdata = []
for i in range(1000):
    rdata.append(random.normalvariate(0,1))

plt.hist(rdata,10);
Combining chart types
Just accumulate plots
plt.hist(rdata,10)
plt.plot([-3,-1,0,1,2,3], [20,30,50,60,80,90], '-r', linewidth=3)
plt.show()
Multiple plots on a figure
fig, axes = plt.subplots(2,1)
plt.sca(axes[0]) #set current axis to first
plt.plot(header[1:],data[0][1:])
plt.ylabel(data[0][0])

plt.sca(axes[1])
plt.plot(header[1:],data[1][1:],'g')
plt.ylabel(data[1][0])
plt.show()
See also GridSpec
Multiple plots on a figure
numgenes = 3
fig, axes = plt.subplots(numgenes,1,sharex=True,sharey=True)
colors = ['b','g','purple']
for i in range(numgenes):
    #most plot methods have equivalents on axes objects
    axes[i].plot(header[1:],data[i][1:],color=colors[i])
    axes[i].set_ylabel(data[i][0])
Saving figures
Instead of plt.show use plt.savefig
bbox_inches='tight' tells matplotlib to try harder to fit everything without extra white space
plt.axes(aspect=1)
plt.pie([8,2,1],labels=["A","B","C"])
plt.savefig("pie.png", bbox_inches='tight')
ls *png
Other formats: pdf, svg, eps...
Activity
https://MSCBIO2025-2025.github.io/files/Spellman.csv
- plot expression over time for a gene
- plot the histogram of initial expression levels
- plot the histogram of final expression levels
- plot the above histograms on the same plot with transparent fill
- plot the above with identical bin sizes for both histograms
- plot the above histograms on different subplots, vertically stacked
